01
Case 01PPC & organic growthSpecialty home & building

From seasonal swings to a $150K month

Category: Specialty home & building productsProduct: Weather sealing and door insulation kits

The challenge

The brand was doing about $37,800 a month, with most of it riding on a few products and the season. The goal was a dependable baseline above $120,000 a month instead of a good quarter followed by a slow one.

What we did

  • Ranked every product by real market demand and put resources behind what shoppers were already searching for.
  • Built keyword research for each product in four intent tiers: product specific, benefit led, generic and root.
  • Treated an early spike from one seasonal, higher ticket product as noise, not proof, and kept building catalog wide.
  • Expanded in phases from tight, high intent terms to broader category coverage so growth did not depend on one SKU.
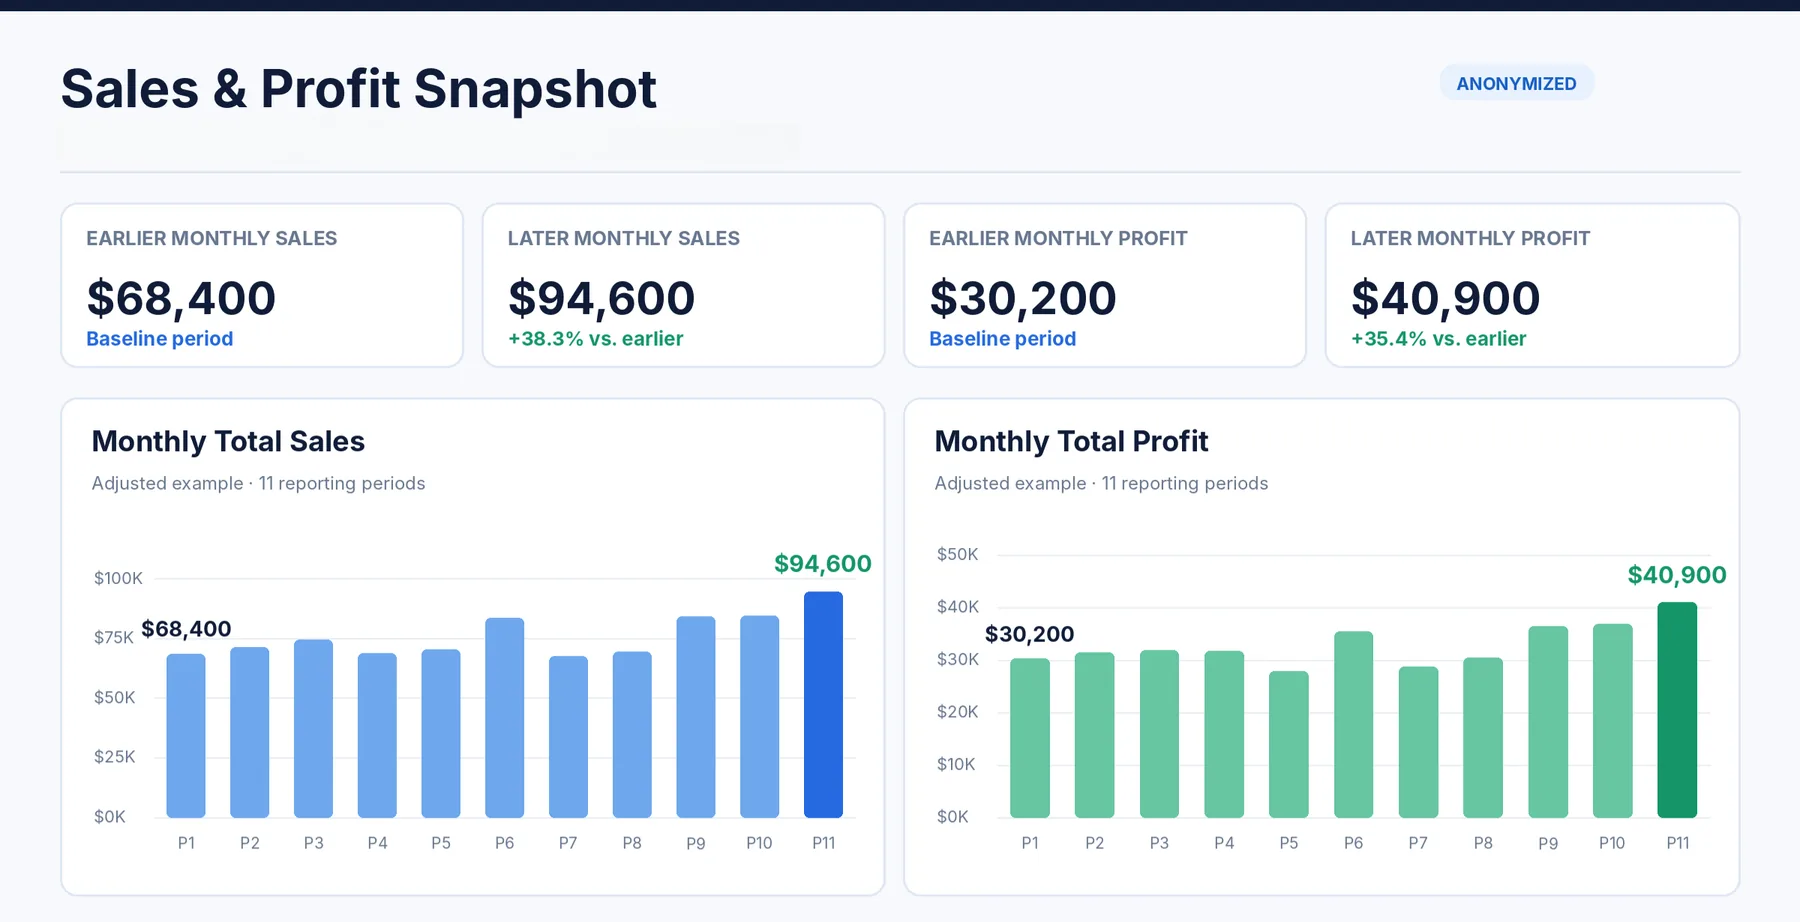
$151.6K
Monthly sales, up from $37.8K
+301.1%
Monthly sales growth
+366.7%
Monthly profit, $8.4K to $39.2K
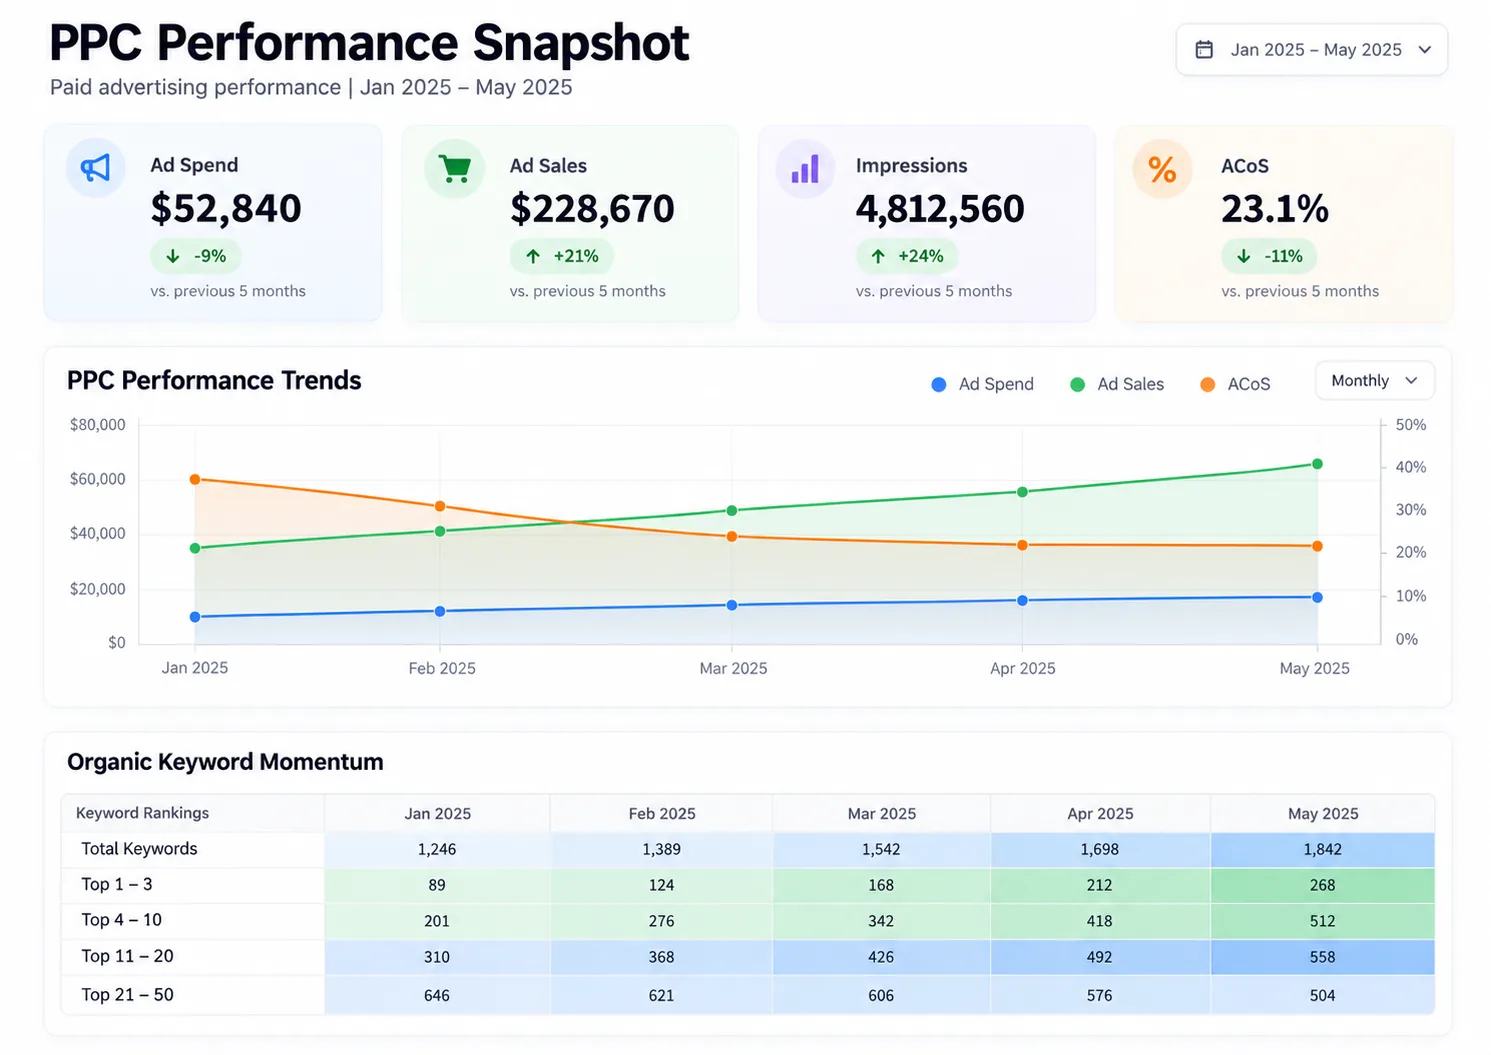
23.1%
ACoS on $52,840 spend and $228,670 ad sales
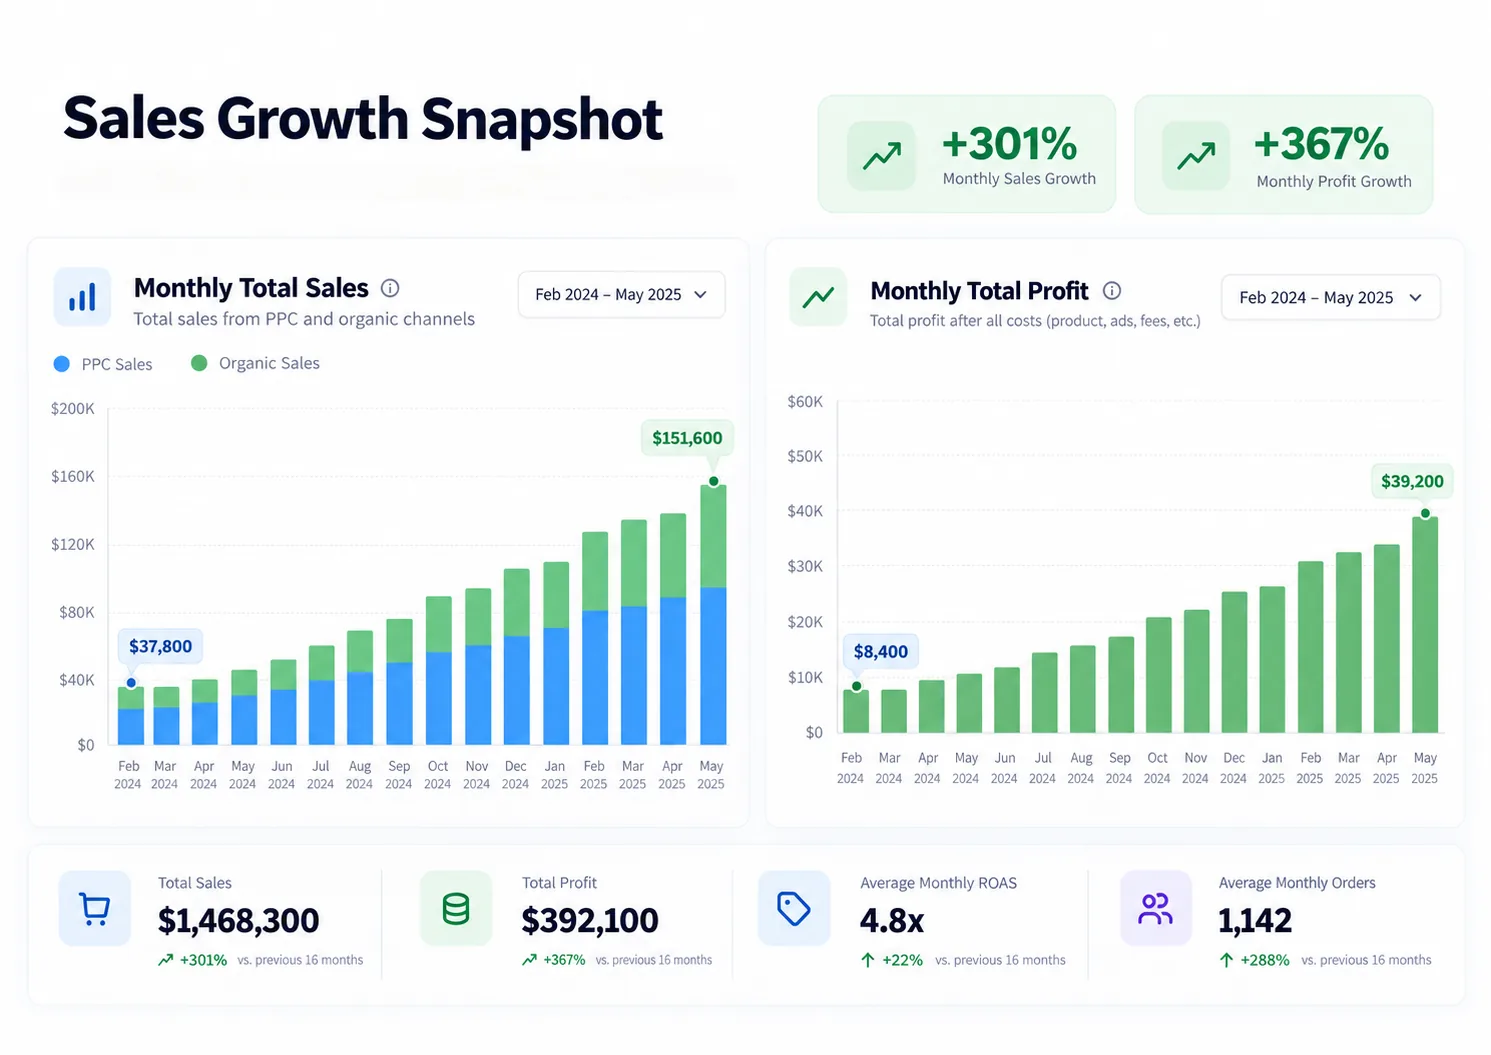
Monthly sales and profit growth
PPC performance and organic keyword momentum
02
Case 02Main image CROHome & kitchen

One main image, a 29.8% conversion lift

Category: Home & kitchenProduct: Airtight aluminum storage jarOnboarded: January 2024

The challenge

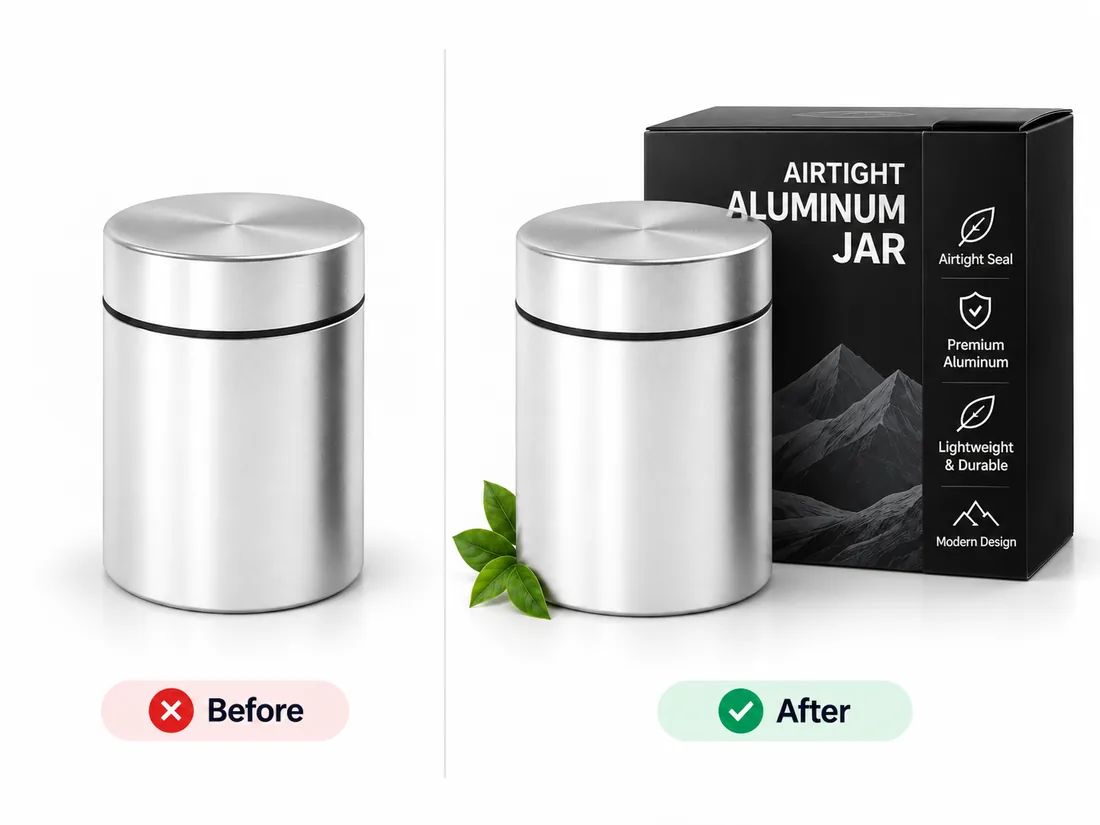
A good product with a listing that was not converting the traffic it already had. The main image showed the jar and nothing else, so it read as a commodity next to competitors.

What we did

  • Ran a controlled A/B test of the main image: the plain jar against a packaging led version.
  • Kept the jar as the hero and placed a premium black box behind it with four clear benefits: airtight seal, premium aluminum, lightweight and durable, modern design.
  • Built the direction from the client's own positioning and kept the image Amazon compliant.
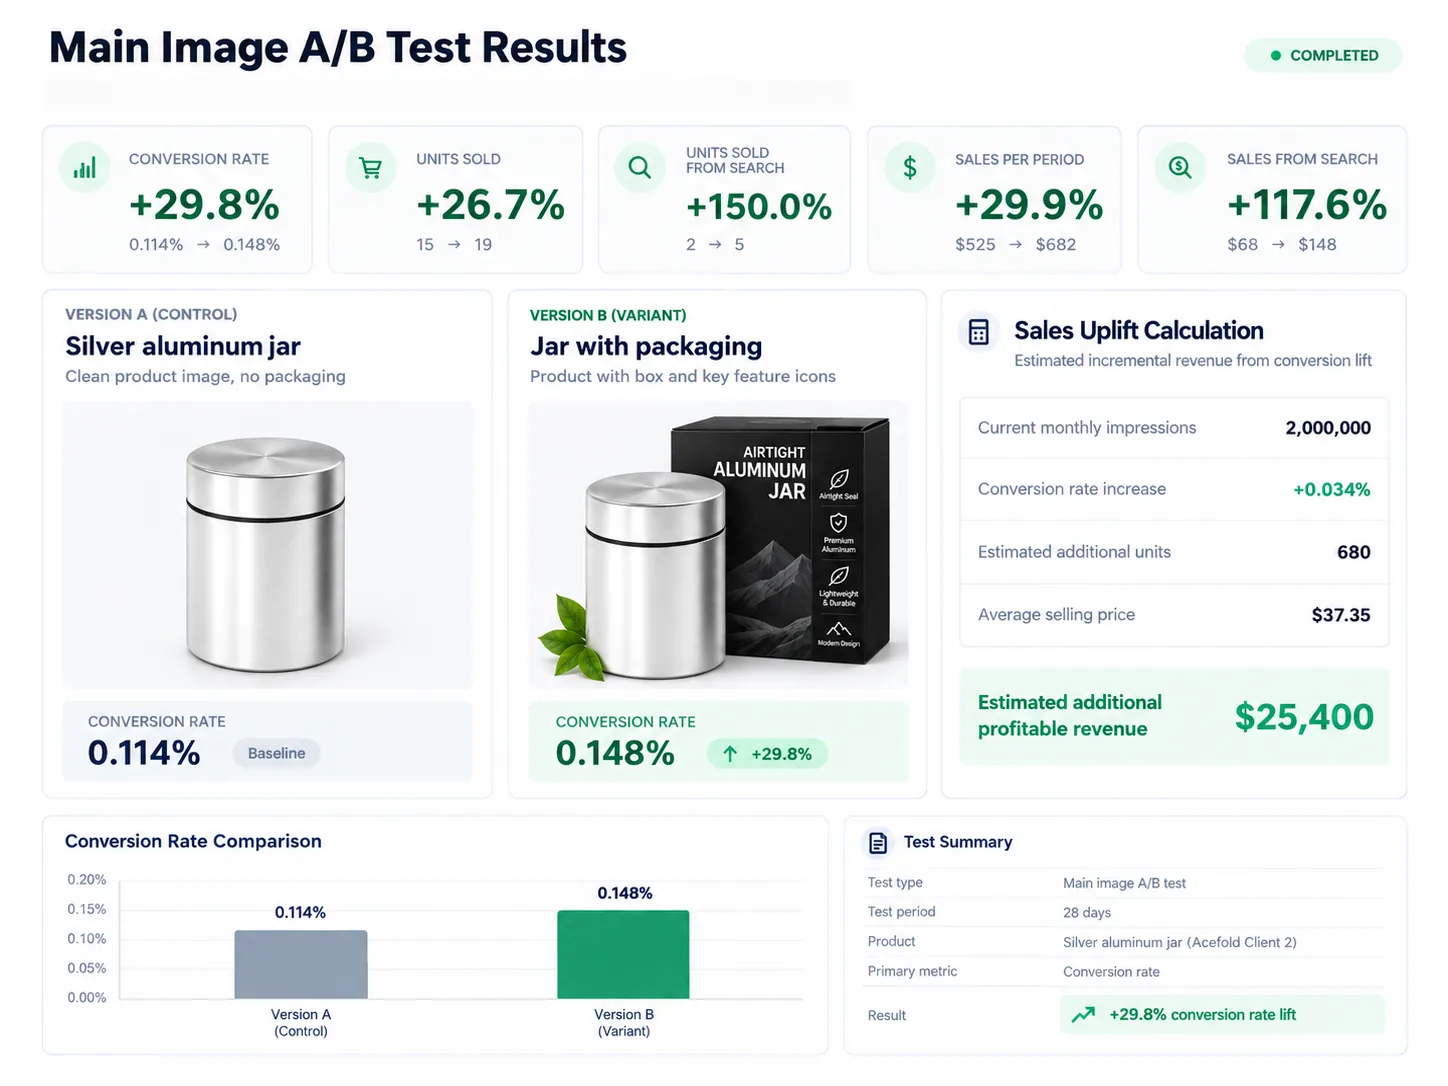
0.148%
Conversion rate, up from 0.114% (+29.8%)
+117.6%
Sales from search, $68 to $148
+150%
Units sold from search, 2 to 5
~$25,400
Added monthly revenue at 2M impressions and a $37.35 price
Projection
Main image before and after
A/B test results
A/B test results
Sales and profit over the following periods
03
Case 03Seasonal PPCHome & garden

Margin in the off season, momentum before the peak

Category: Home & gardenProduct: Seasonal soil care and plant starting suppliesOnboarded: 2023

The challenge

The previous approach chased the same sales target every month, including months when nobody was shopping for planting supplies. That burned ad spend in the quiet months and left the account unprepared for the real season.

What we did

  • Off season: switched the goal from orders to contribution margin, streamlined campaigns and cut wasted spend.
  • Pre season: started the ramp six to eight weeks before demand, prioritizing product relevant, high intent keywords.
  • Peak season: raised budgets selectively on proven search terms for top of search visibility, with ACoS held in check.
$44.8K
Peak monthly sales, up from $17.8K
+151.1%
Monthly sales growth
$8.3K to $13.5K
Monthly profit
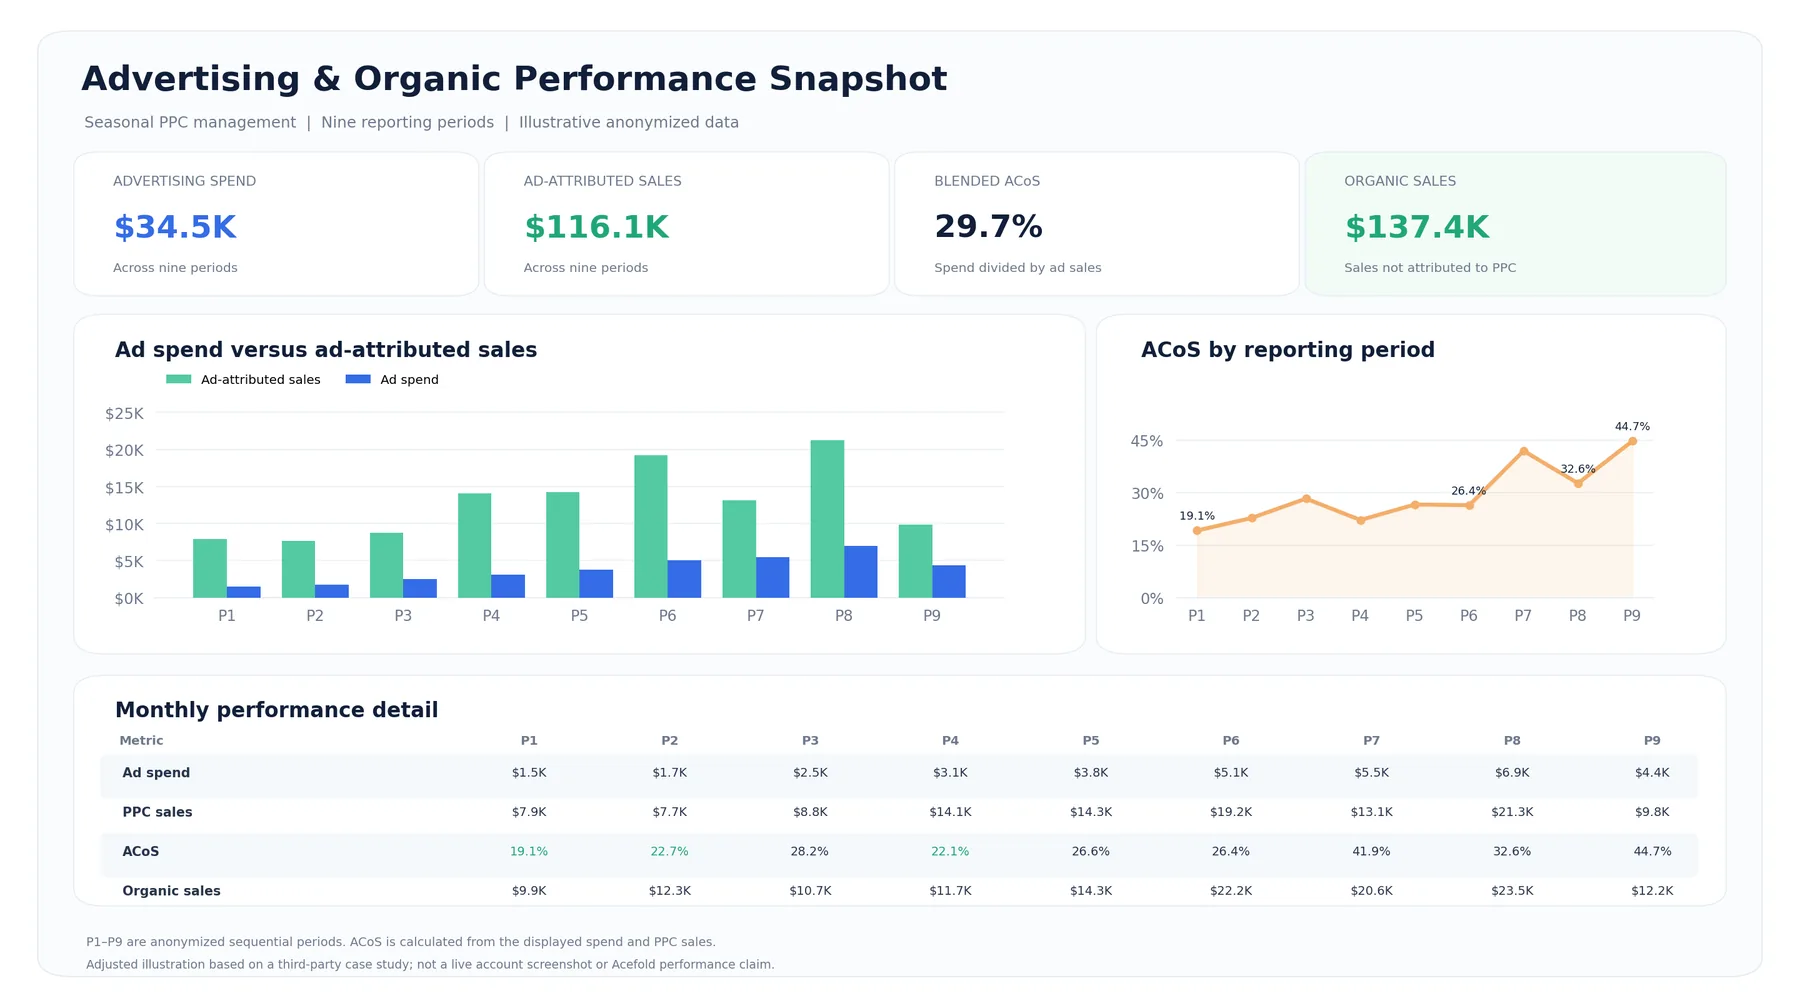
29.7%
Blended ACoS on $34,530 spend and $116,120 ad sales
Ad spend, ad sales, ACoS and organic sales by period
04
Case 04PPC & organic growthSports & outdoors

Holiday level sales in the off season

Category: Sports & outdoorsProduct: Outdoor gear, wearables and survival toolsOnboarded: January 2025

The challenge

After a strong Q4 the account needed to hold that momentum through Q1. The budget was spread across campaigns without enough weight on the terms and placements that were already winning.

What we did

  • Combined the Search Term Impression Share report with Search Query Performance data to find the keywords where the listing already beat the market.
  • Pulled budget out of underperforming campaigns and moved it to those winning terms.
  • Refreshed brand content and the main image to lift conversion and organic momentum together.
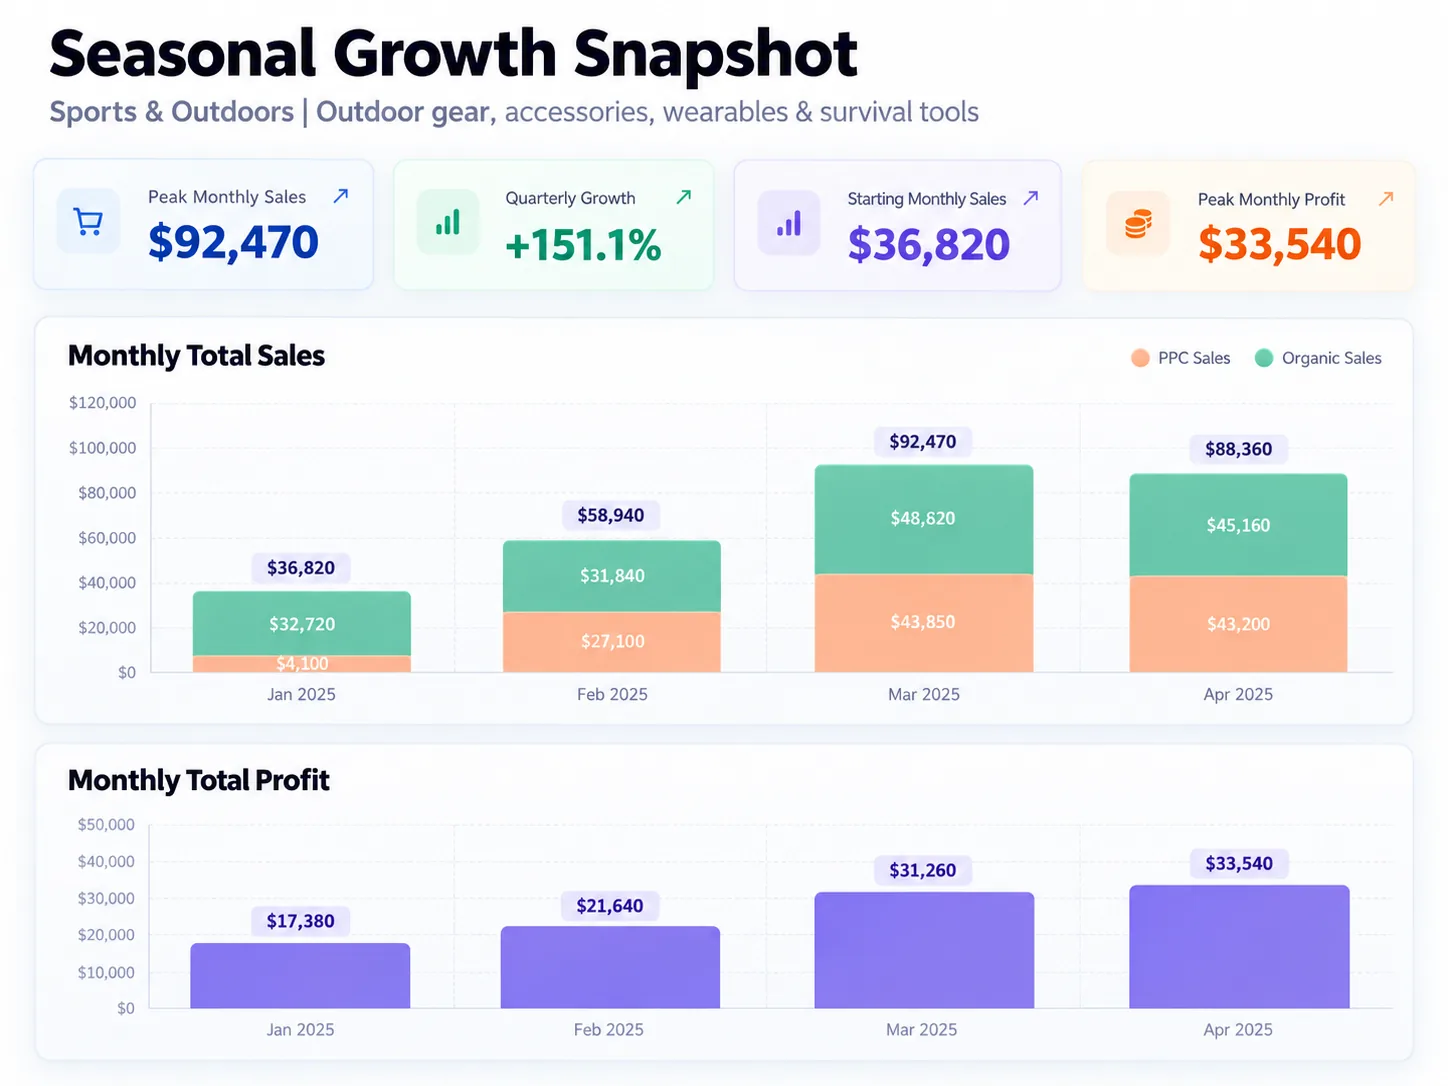
$92.5K
Monthly sales in March 2025, up from $36.8K in January
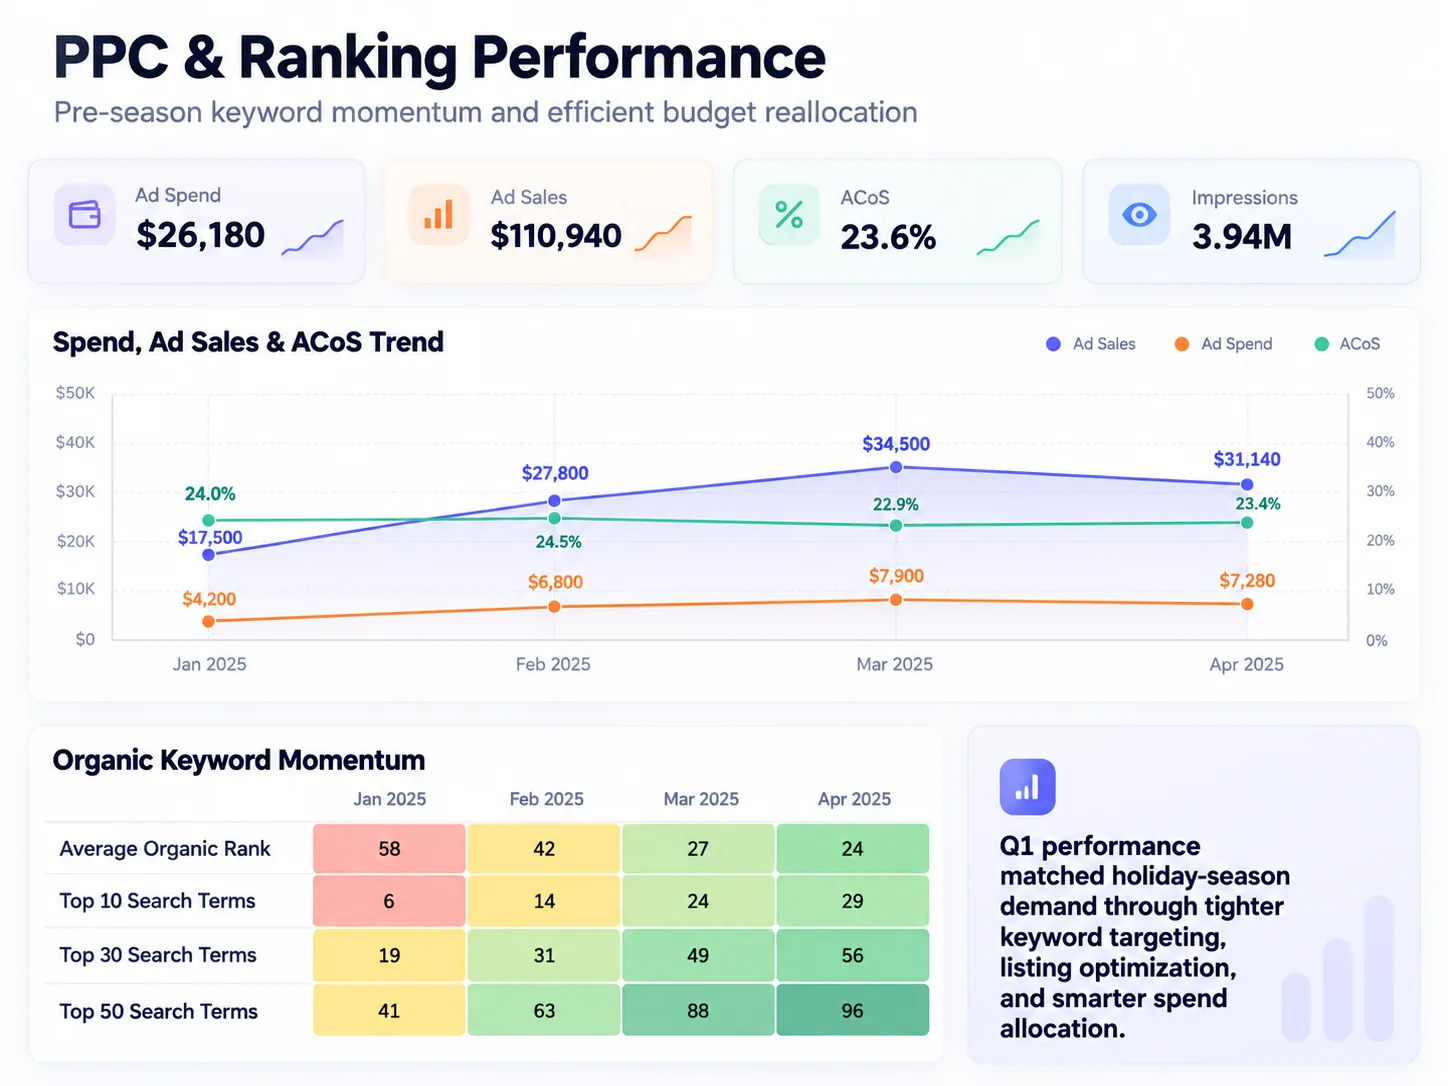
58 to 24
Average organic rank
6 to 29
Search terms ranking in the top 10
23.6%
ACoS on $26,180 spend and $110,940 ad sales
Monthly sales and profit, January to April 2025
PPC trend and organic keyword momentum
05
Case 05PPC & organic growthGrocery & gourmet

Breaking a $20K plateau the disciplined way

Category: Grocery & gourmet foodProduct: Roasted coffee and brewing accessoriesOnboarded: Late 2024

The challenge

Sales had flattened around $19,700 a month. Paid traffic was not turning into organic visibility, and the structure was not efficient enough to justify spending harder.

What we did

  • Cleaned up the campaign structure and cut inefficient activity before raising budgets.
  • Held revenue steady in the opening phase while tightening contribution margin.
  • Paired high potential keywords with lower competition, high efficiency terms.
  • Launched catch all and seed campaigns for keyword discovery and low ACoS orders. Catch all became one of the top order drivers.
  • Used relevant paid traffic to build organic keyword visibility for the next stage.
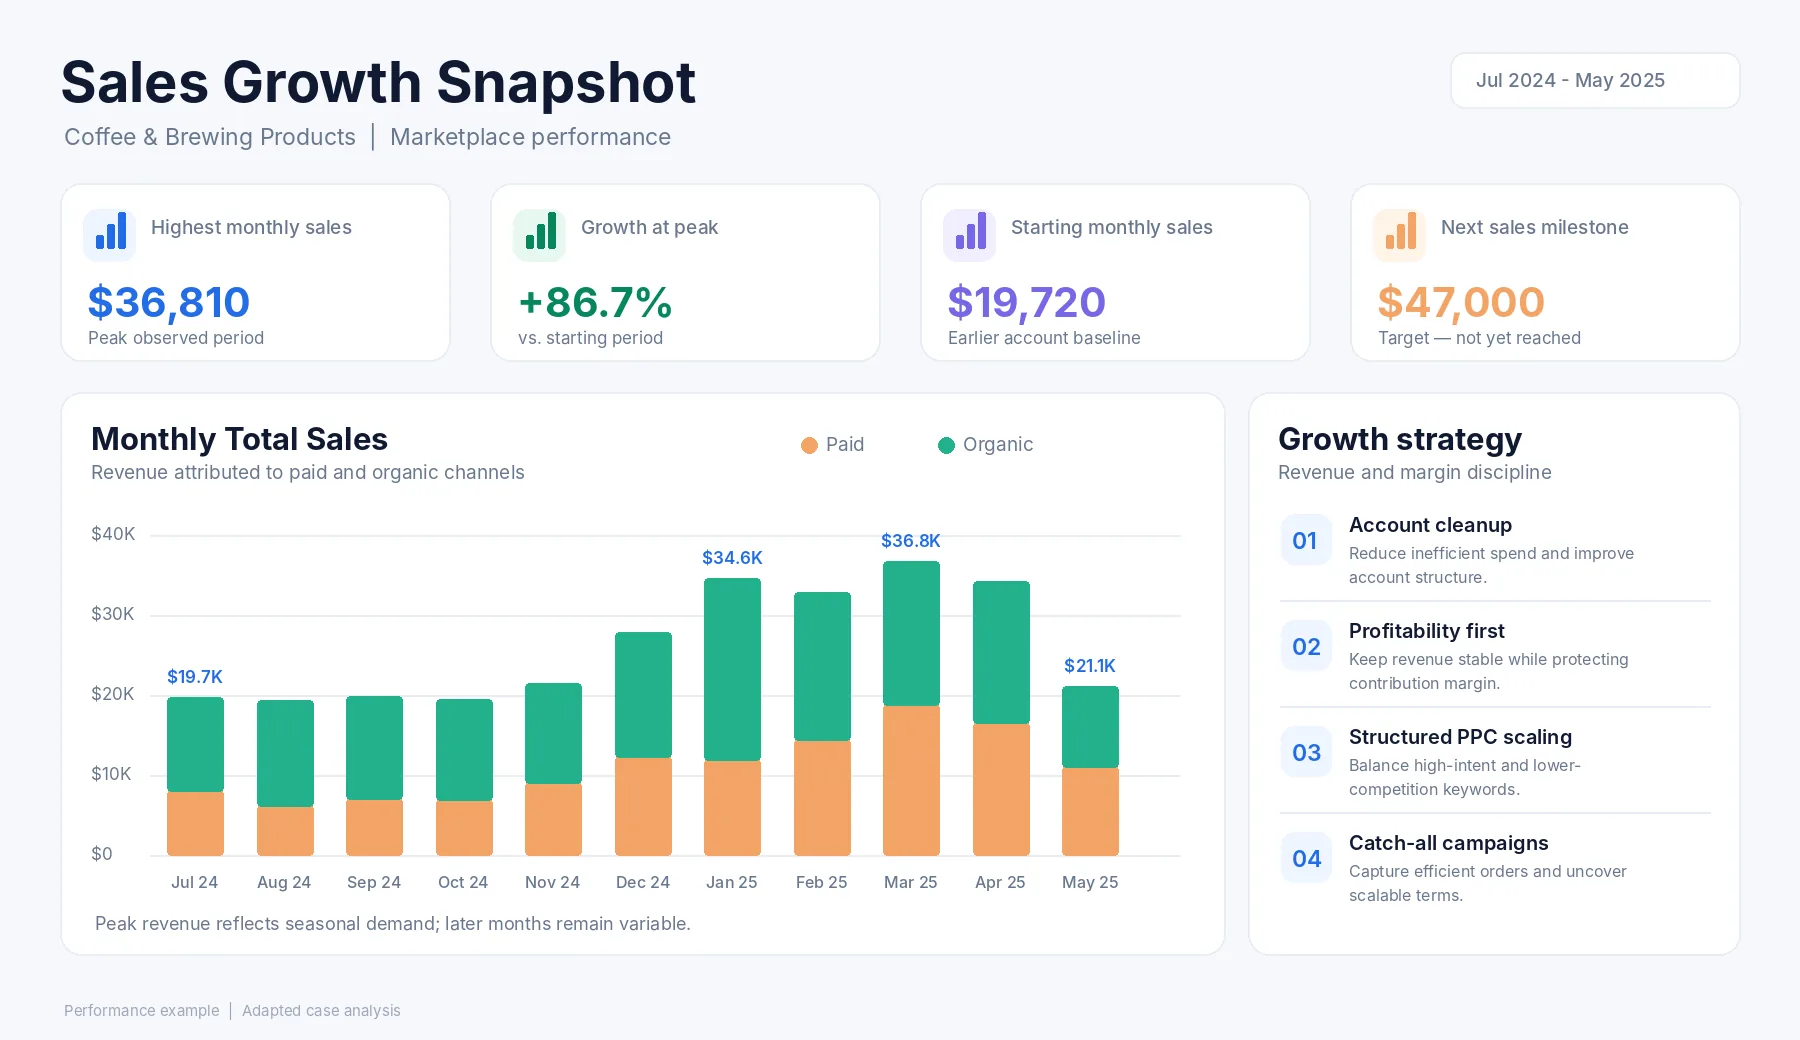
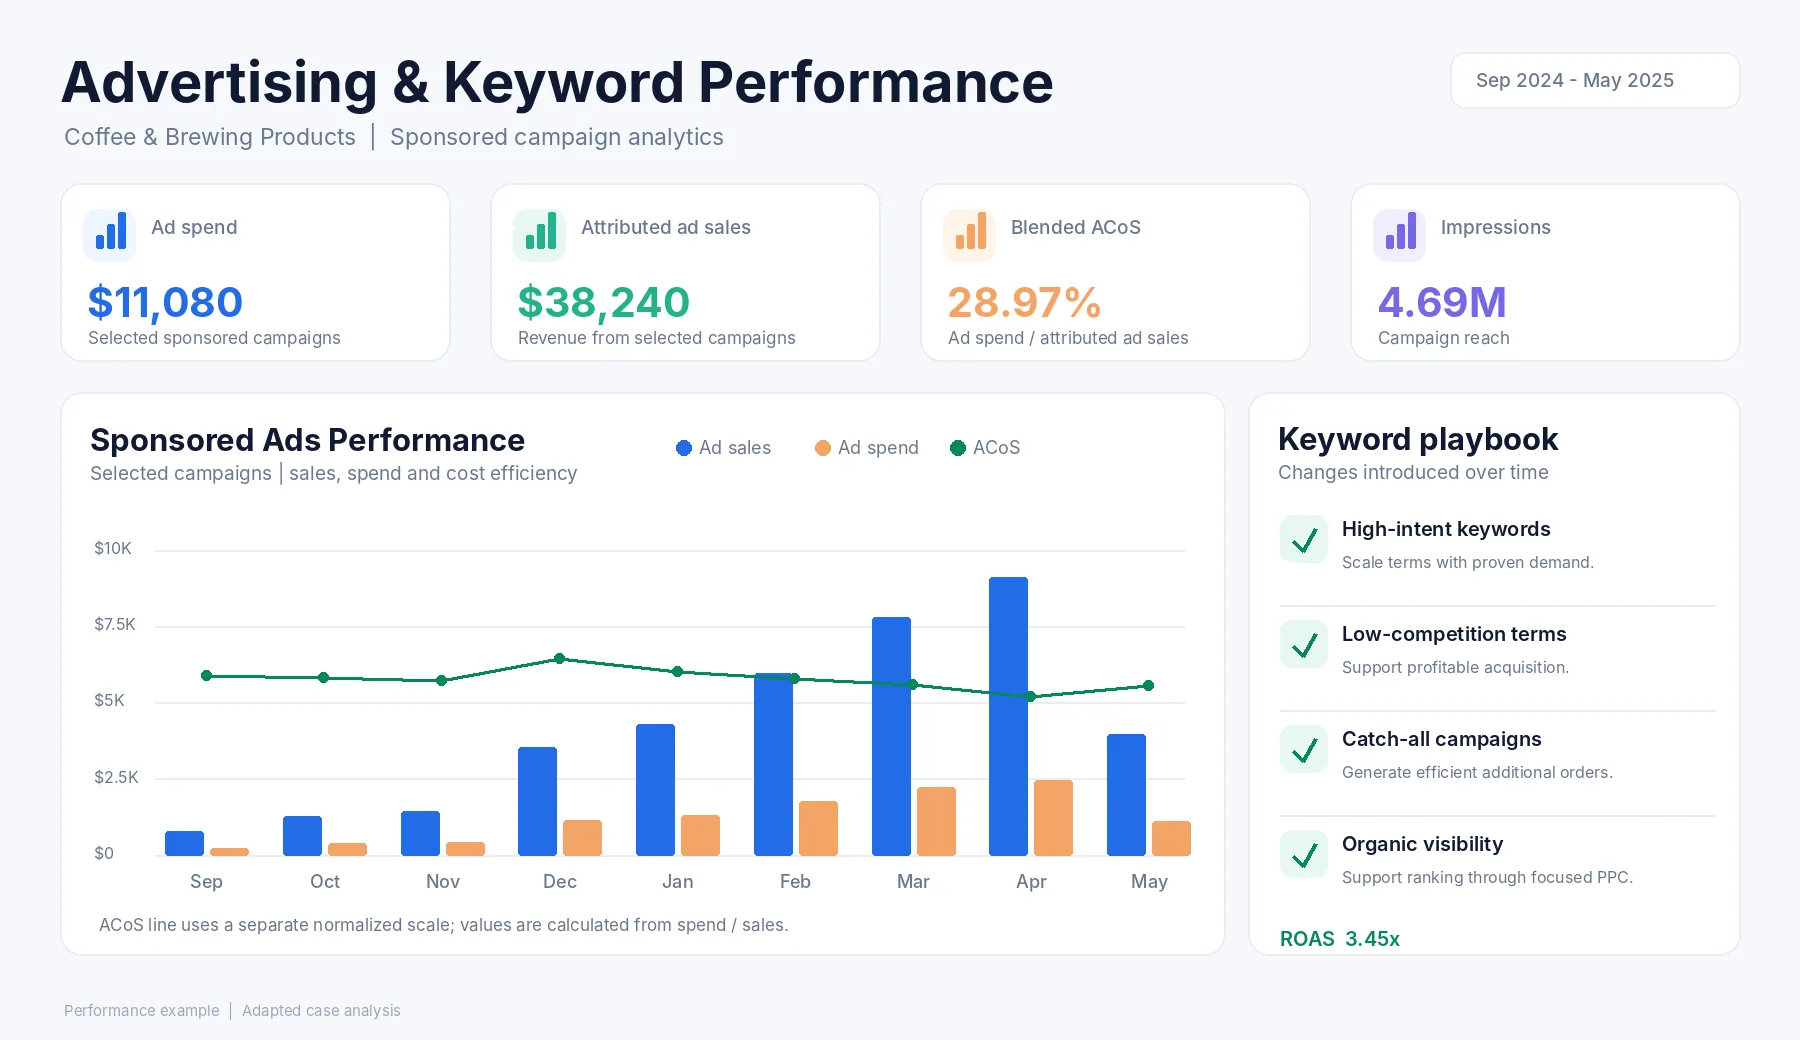
$36.8K
Peak monthly sales, up from $19.7K
+86.7%
Monthly sales growth
28.97%
Blended ACoS on $11,080 spend and $38,240 ad sales
$47K
Next monthly sales milestone, in progress
Projection
Monthly paid and organic sales
Sponsored ads performance and keyword playbook
06
Case 06Seasonal PPCPet supplies

From a sales decline to a $115K month

Category: Pet suppliesProduct: Dog wellness chewsOnboarded: Late 2024

The challenge

After a strong year, sales had been sliding, and previous management had not found a way past $100,000 a month. Q4 demand was soft for this category, while Q1 historically brought stronger search volume and conversion.

What we did

  • Studied year over year data to find the keywords with the strongest Q1 demand.
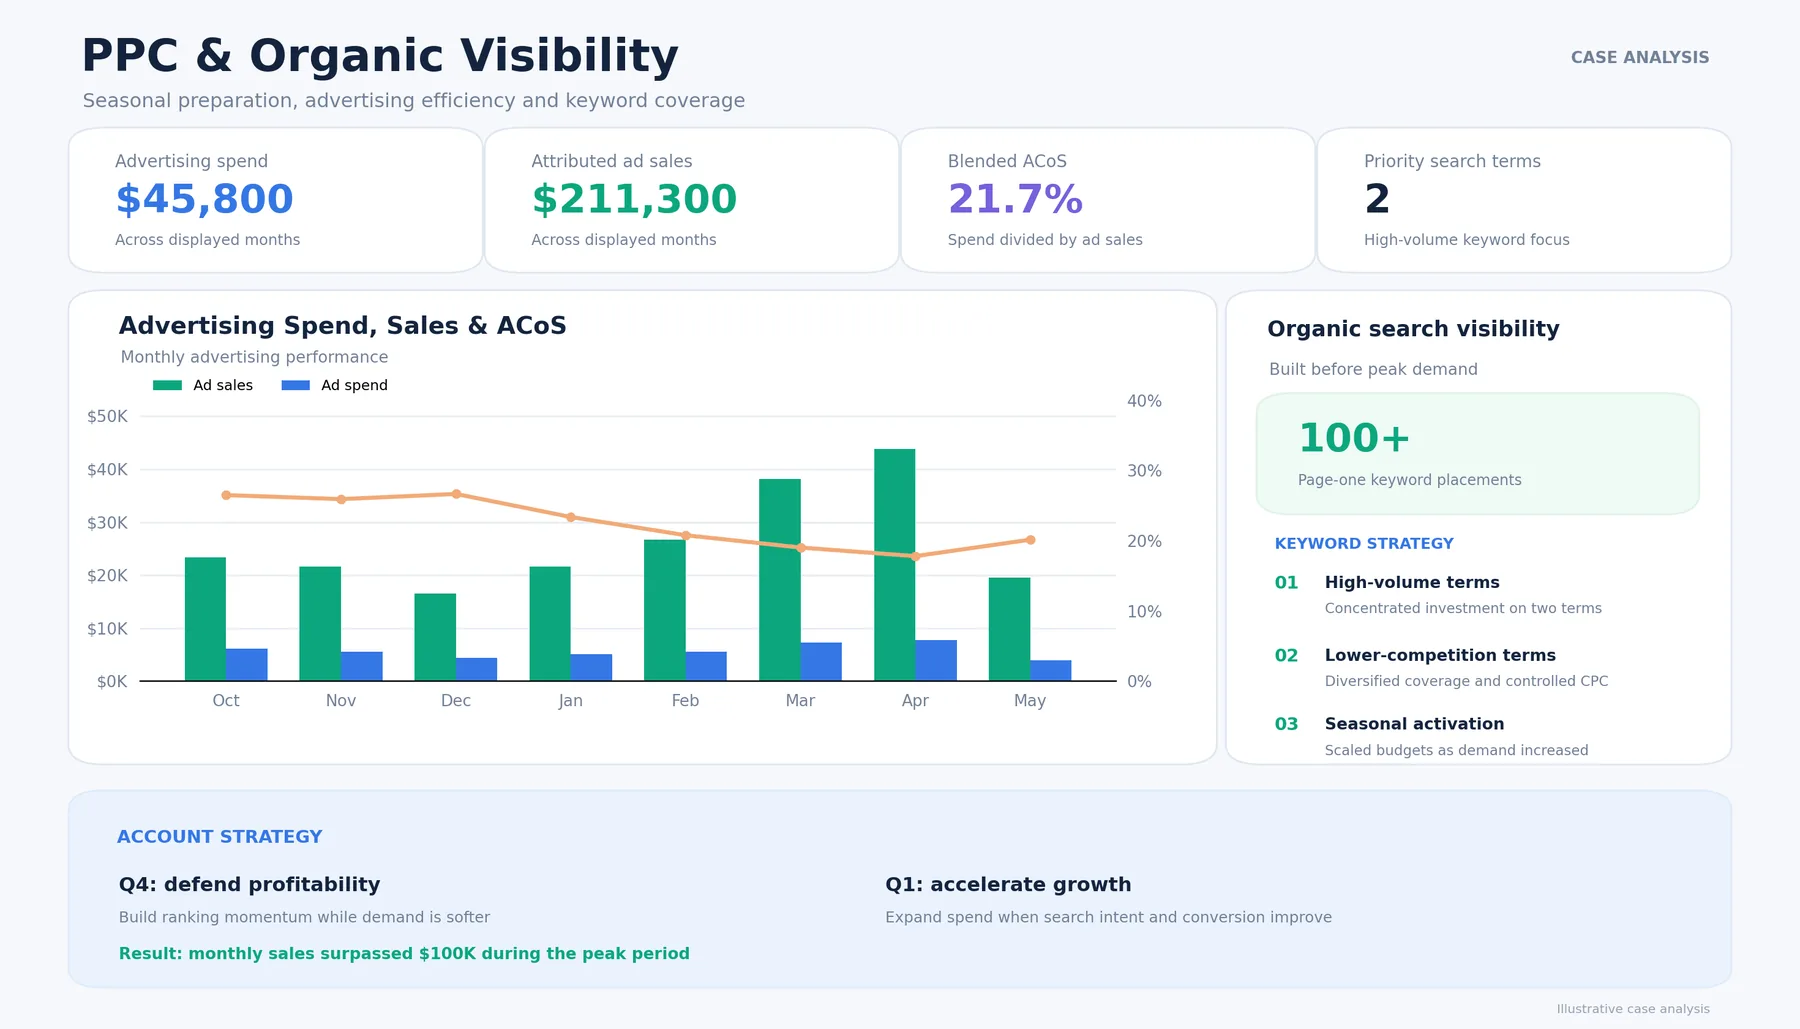
  • Concentrated budget on two high volume terms instead of scattering it across a broad list.
  • Used Q4 to protect margin, refine targeting and build early visibility before demand returned.
  • Added lower competition keywords to diversify coverage and keep CPCs efficient.
  • Raised bids and coverage as buying intent climbed through Q1 and early spring.
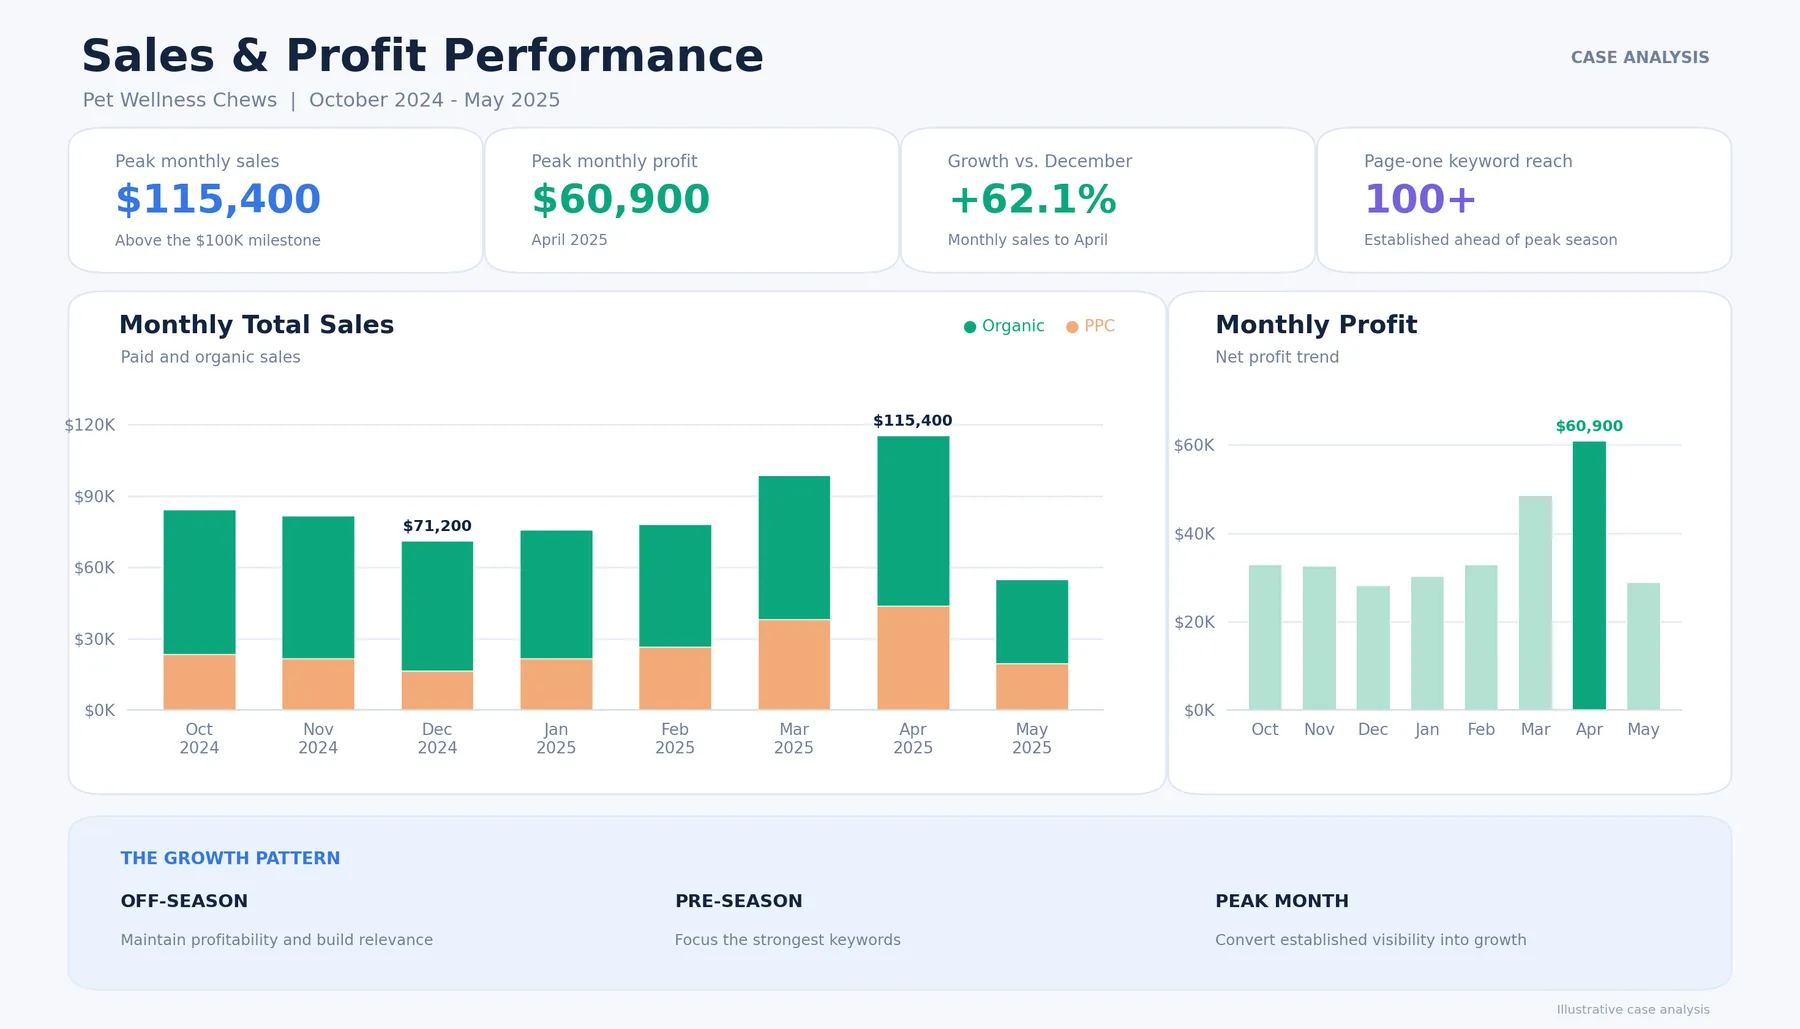
$115.4K
Peak monthly sales in April, up from a $71.2K December low
$60.9K
Peak monthly profit
100+
Keywords on page one before the peak
21.7%
Blended ACoS on $45,800 spend and $211,300 ad sales
Monthly sales and profit, October 2024 to May 2025
Ad spend, ad sales, ACoS and keyword strategy
07
Case 07Main image CROSports & outdoors

A jump rope listing that sold 20% more from the same traffic

Category: Sports & outdoorsProduct: Adjustable performance jump ropeFocus: Main image A/B test

The challenge

Shoppers were landing on the listing, but the main image showed a plain rope and handles. It did not show the included accessories or why this rope was worth the price.

What we did

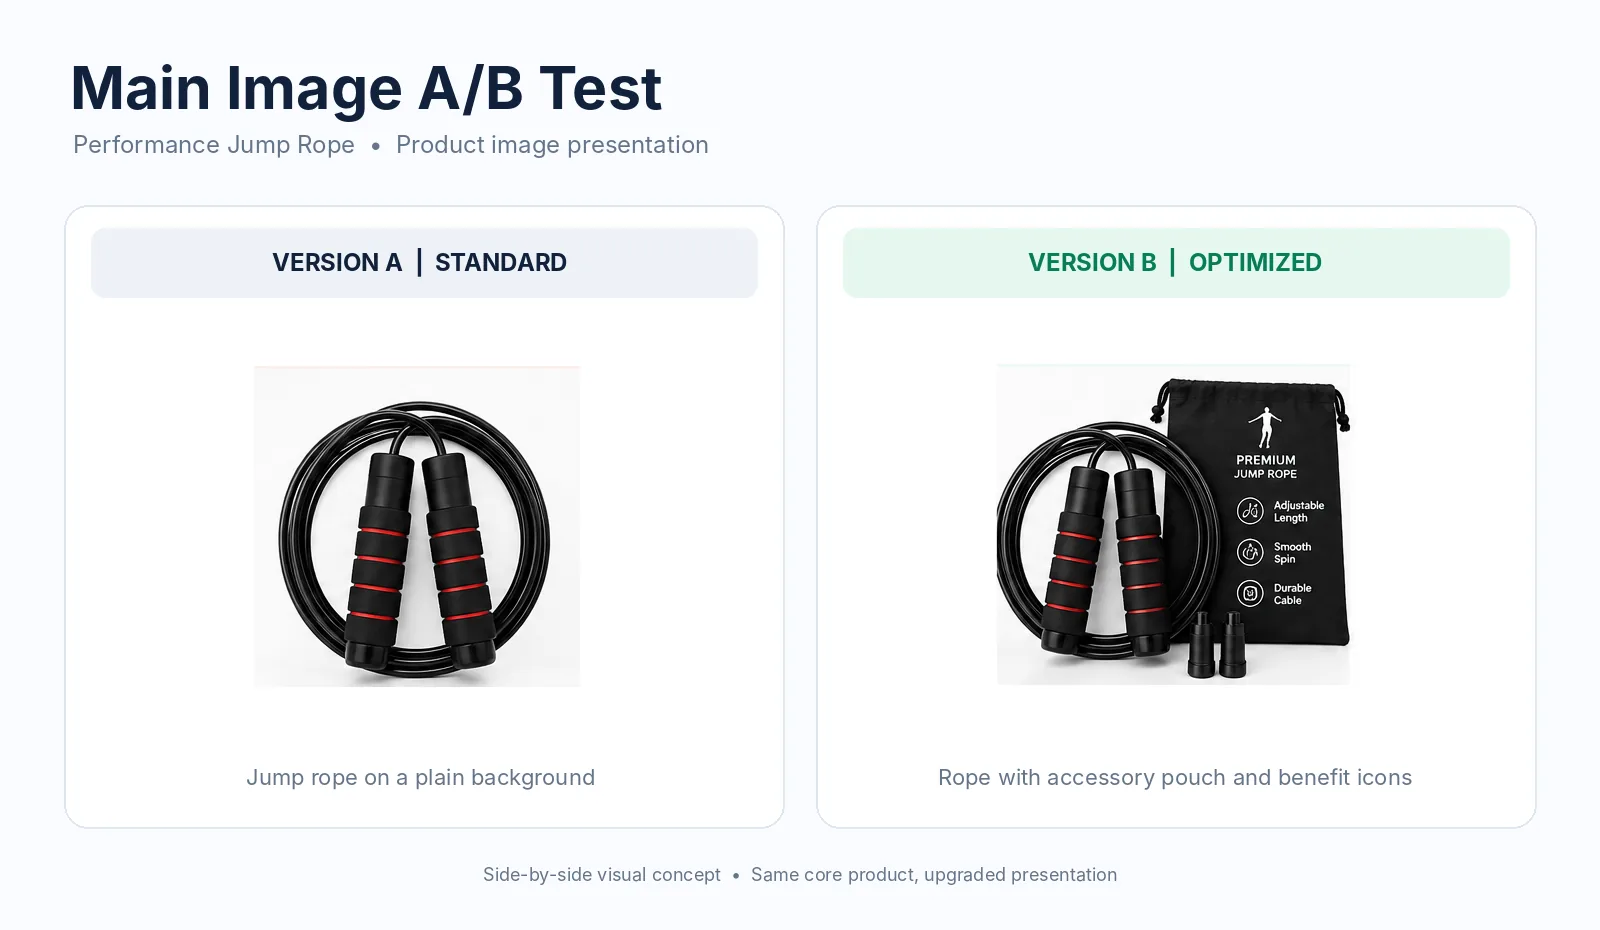
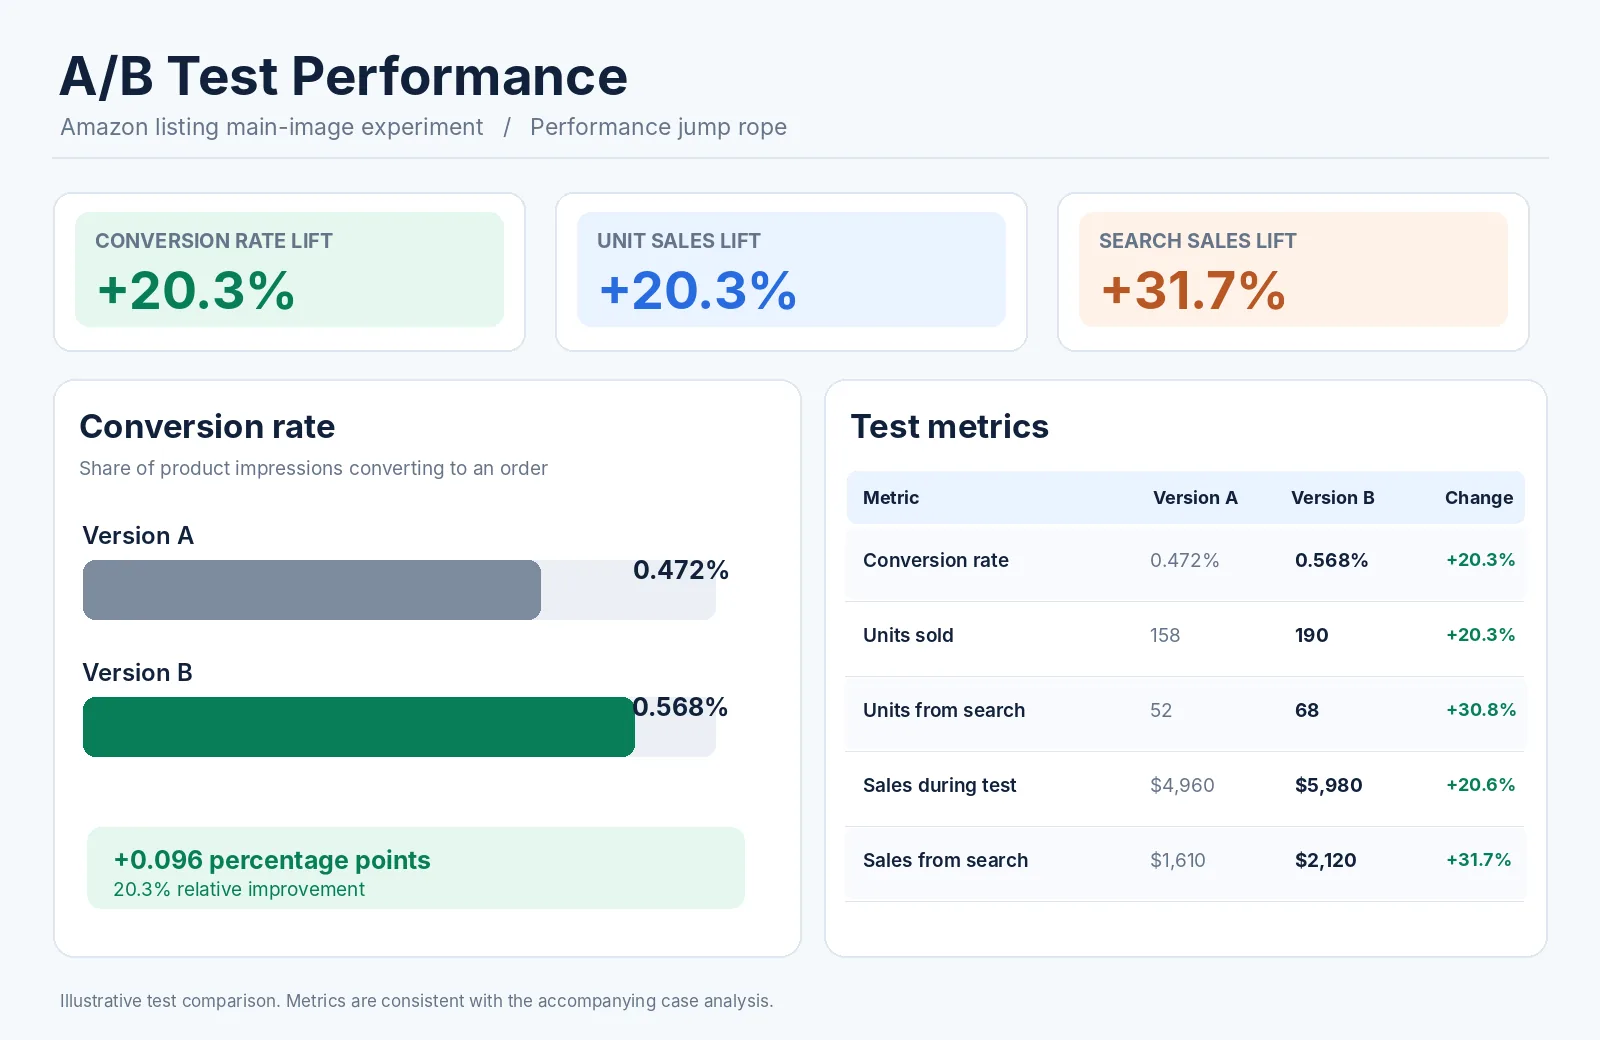
  • Tested two main images with the rope and handles identical, so the only variable was the composition.
  • Version B added the premium carry pouch and three feature icons: adjustable length, smooth rotation and cable durability.
  • Measured conversion, units and sales from search over the same test window, with no change to ad spend.
0.568%
Conversion rate, up from 0.472% (+20.3%)
+31.7%
Sales from search, $1,610 to $2,120
+30.8%
Units from search, 52 to 68
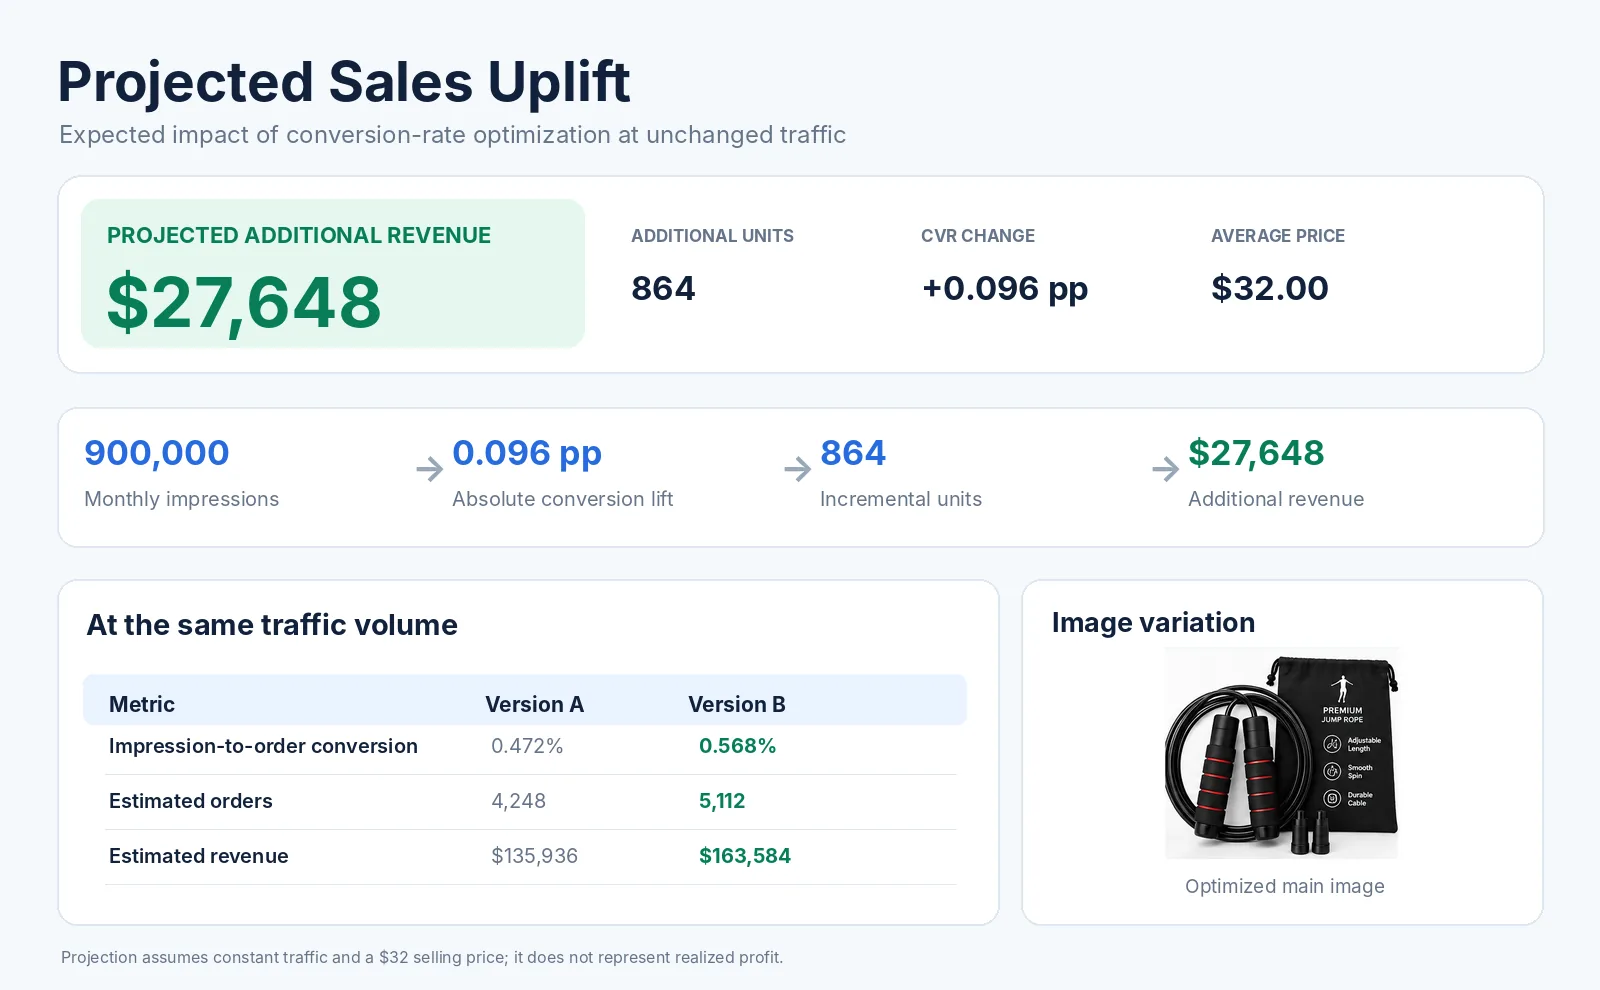
$27,648
Added monthly revenue at 900K impressions and a $32 price
Projection
Version A and Version B
A/B test metrics
A/B test metrics
Projected uplift at the same traffic
08
Case 08Main image CROHome & office

Five products, one testing method, $183K projected per year

Category: Home & office productsProducts: 5 listings across furniture and hardwareFocus: Main image CRO across a product line

The challenge

Demand was strong across the line, but several listings were not converting as well as they should. The main images were functional and did not communicate value, use case or quality at first glance.

What we did

  • Tested each product with the same before and after framework.
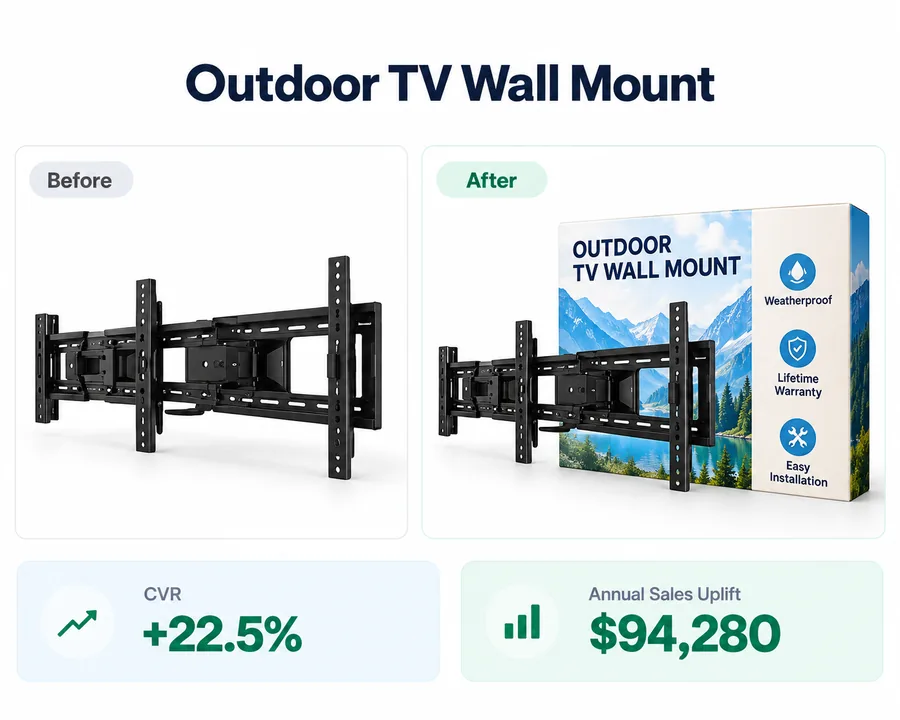
  • Kept every product as the hero and added premium packaging, context and short benefit callouts only where they helped.
  • Rolled the same method across the line so wins could be repeated instead of guessed.
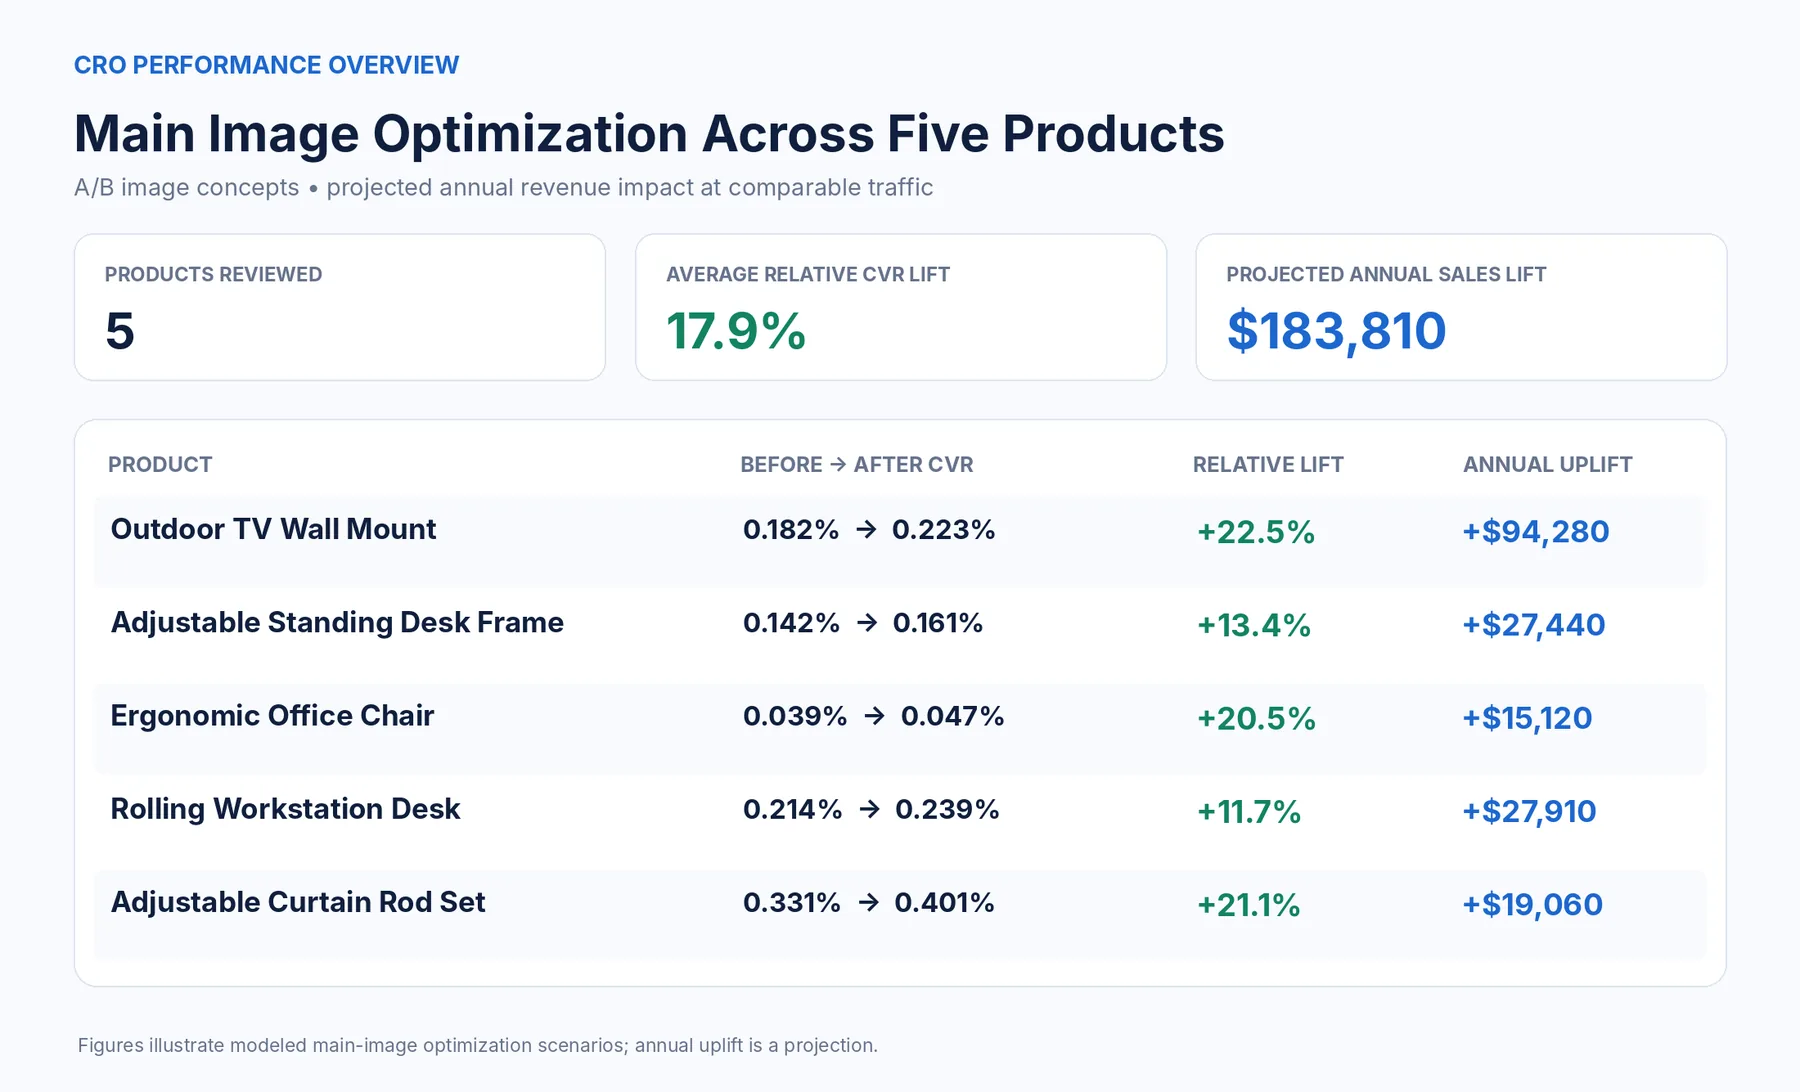
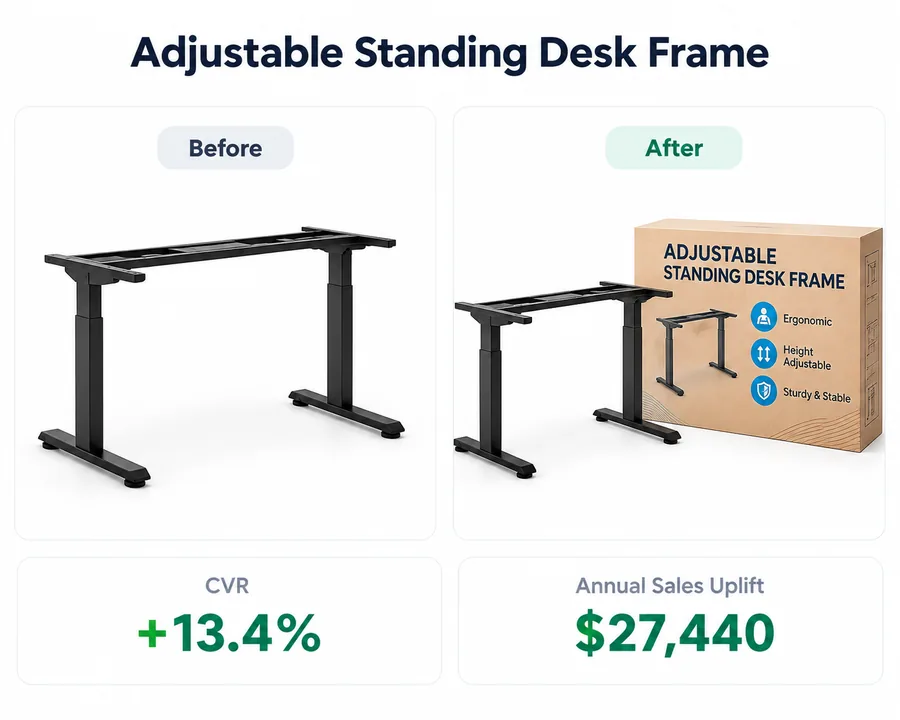
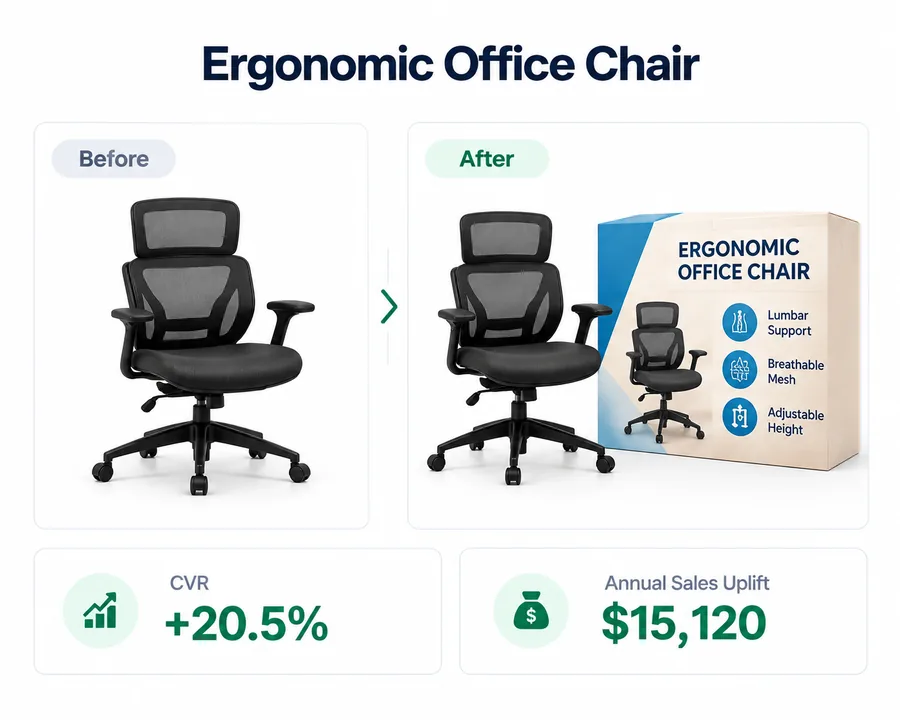
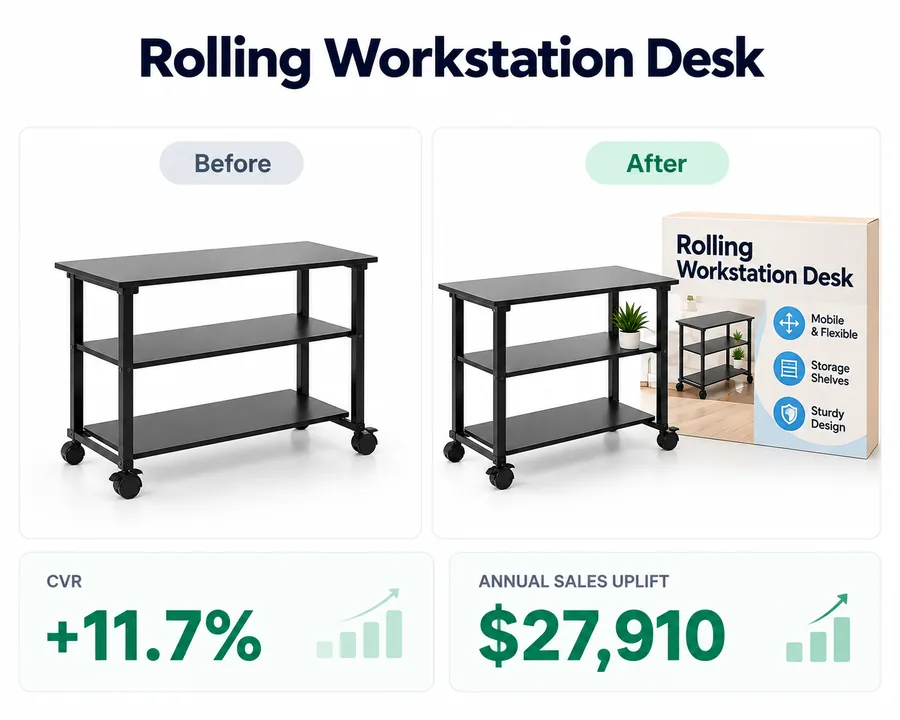
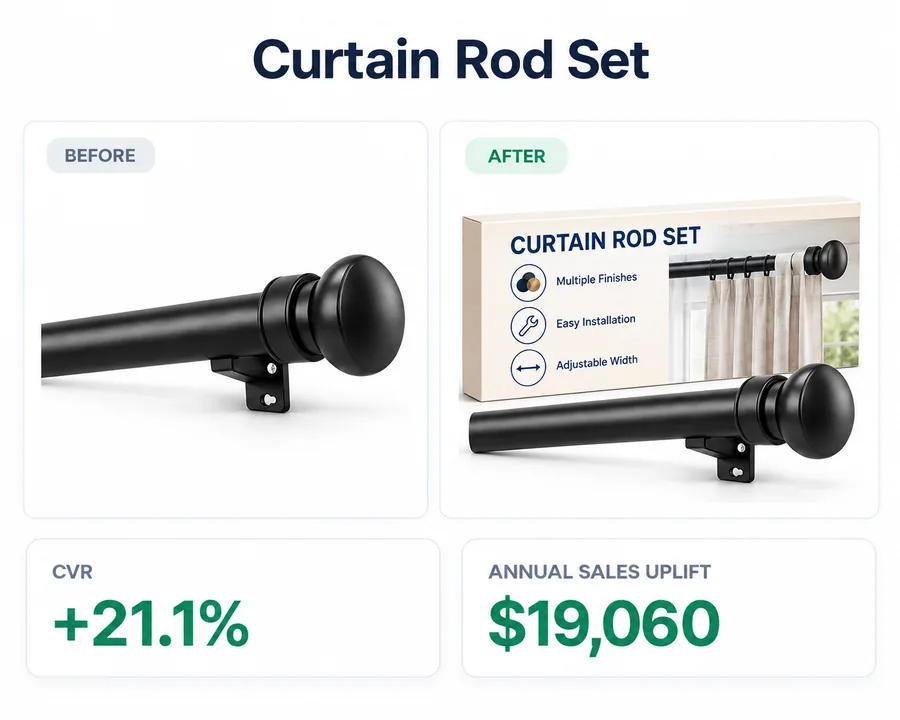
$183,810
Annual sales uplift across five products
Projection
+22.5%
Best CVR lift, outdoor TV wall mount
~18%
Average CVR lift across the five
5 of 5
Optimized images beat the originals
Results across all five products
Outdoor TV wall mount: +22.5% CVR
Standing desk frame: +13.4% CVR
Ergonomic office chair: +20.5% CVR
Rolling workstation desk: +11.7% CVR
Curtain rod set: +21.1% CVR

Client names, ASINs and identifying details are withheld. Figures are adjusted for confidentiality while keeping the scale of each result, and every projection is labeled as a projection.

For premium Amazon brands

Want numbers like these?

90 minutes. No deck. A straight read on your Amazon account and where the ad spend is leaking.

Four aces. One hand.

Book your free audit